

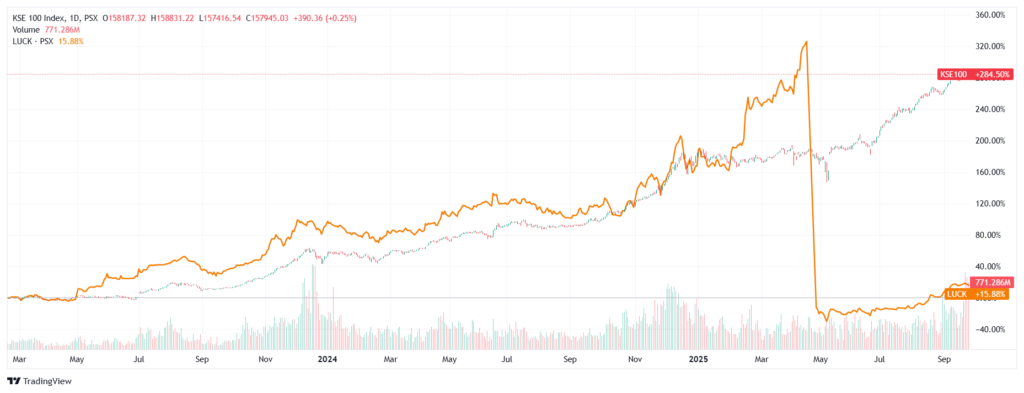
In Pakistan, cement isn’t just a grey powder; it’s the foundation of everything from building highways to homes. Among the players driving this industry, Lucky Cement Limited (LUCK) is a market champion and an icon of financial strength. To investors, it provides a compelling mix of profitability, scale benefits, and, notably, Shariah compliance, which makes it particularly attractive in a nation where Islamic finance is gaining serious momentum.
Company Overview & Business Model
Founded in 1993 and part of the Yunus Brothers Group, Lucky Cement has grown into Pakistan’s largest cement producer, with an impressive annual capacity of over 15 million tons. Based in Karachi, it has major plants located in Pezu (Khyber Pakhtunkhwa) and Karachi that supply domestic as well as international markets. The company is a leading exporter, supported by its own loading and storage terminal at Karachi Port.
But Lucky Cement isn’t just about cement anymore.
Over the years, it’s evolved into a diversified powerhouse. From energy generation to chemicals (via Lucky Core Industries) and even automobile assembly, the company has built a portfolio that reflects both ambition and strategic foresight. Lucky Cement’s objective is innovation, quality, and customer satisfaction, accompanied by a commitment to responsible corporate behavior. Its steady growth, solid market share, and adherence to environmentally friendly operations make it a key contributor to Pakistan’s industrial and economic development.
Learn the truth about risk & return in Pakistan
Financial Performance Overview (2020–2025)
Income Statement
| Income Statement PKR in Millions | ||||||
| Particulars | 2025 | 2024 | 2023 | 2022 | 2021 | 2020 |
| Turnover – Net | 124,512 | 115,325 | 95,832 | 81,094 | 62,941 | 41,871 |
| Gross Profit | 42,685 | 38,805 | 26,061 | 22,552 | 18,956 | 6,077 |
| Operating Profit | 31,285 | 28,870 | 18,908 | 16,275 | 12,840 | 1,188 |
| Profit before Taxation & Levy | 47,323 | 41,388 | 21,343 | 21,421 | 16,992 | 3,820 |
| Profit after Taxation | 33,092 | 28,107 | 13,726 | 15,299 | 14,070 | 3,344 |
| Total Comprehensive Income | 32,544 | 27,972 | 13,984 | 15,340 | 14,016 | 3,508 |
| Earnings per Share (Rs.) | 22.59 | 18.91 | 8.61 | 9.46 | 8.70 | 2.07 |
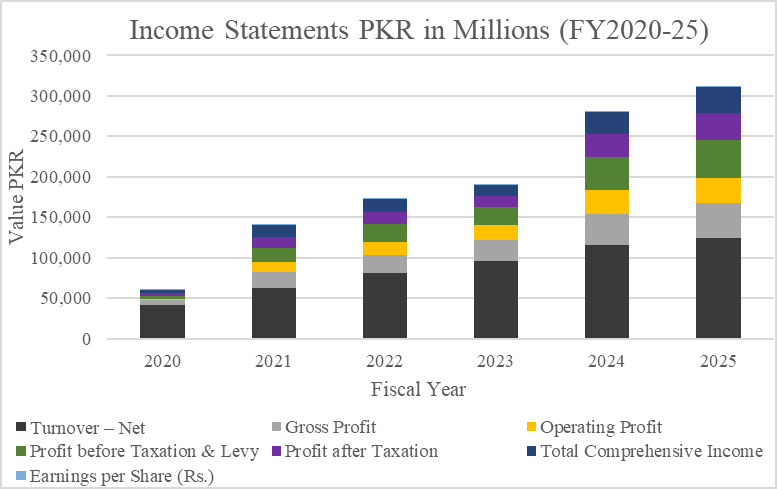
Over the past six years, Lucky Cement’s numbers have not just grown; it tells a story of transformation. Revenues have nearly tripled from PKR 41.9 billion to PKR 124.5 billion in 2025. Driven by expanded capacity, stronger exports, and a firm grip on domestic demand.
But the real story lies in its profitability.
Gross Profit jumped from PKR 6.1 billion to PKR 42.7 billion, while Operating Profit surged from just PKR 1.2 billion to PKR 31.3 billion. These are not just numbers; they’re the indicators of a company that has improved its efficiency, optimized its production, and made smarter use of energy.
Then comes the leap in Profits after tax, from PKR 3.3 billion to PKR 33 billion in six years. An astonishing tenfold increase. Even Total Comprehensive Income, which captures the full picture of gains and losses, followed suit, rising from PKR 3.5 billion to PKR 32.5 billion.
As for the investors, the biggest indicator is the EPS. Rising from PKR 2.07 in 2020 to 22.59 in 2025. That’s not just growth, that’s creation of value at scale.
Balance Sheet
| Balance Sheet | ||||||
| Particulars | 2025 | 2024 | 2023 | 2022 | 2021 | 2020 |
| Share Capital & Reserves | 175,910,400 | 147,761,277 | 137,366,326 | 128,540,324 | 113,200,258 | 99,183,861 |
| Non-Current Liabilities | 32,196,247 | 32,068,340 | 29,531,862 | 26,060,686 | 12,780,738 | 7,729,261 |
| Current Liabilities | 58,641,383 | 54,188,473 | 46,180,879 | 30,361,358 | 30,387,066 | 28,955,352 |
| Total Equity & Liabilities | 266,748,030 | 234,018,090 | 213,079,067 | 184,962,368 | 156,368,062 | 135,868,474 |
| Non-Current Assets | 166,200,671 | 165,566,006 | 153,502,425 | 140,146,677 | 115,691,694 | 107,493,561 |
| Current Assets | 100,547,359 | 68,452,084 | 59,576,642 | 44,815,691 | 40,676,368 | 28,374,913 |
| Total Assets | 266,748,030 | 234,018,090 | 213,079,067 | 184,962,368 | 156,368,062 | 135,868,474 |
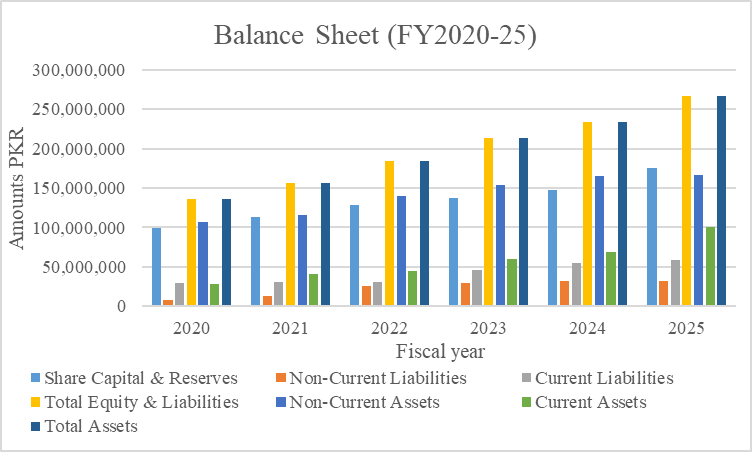
Lucky Cement’s balance sheet over the past six years depicts strong growth. Total assets nearly doubled, from PKR 135.9 billion in 2020 to PKR 266.7 billion in 2025, driven by both long-term investments and a sharp rise in current assets. Shareholders’ equity also improved significantly, growing from PKR 99.2B to PKR 175.9B, indicating strong retained earnings and reinvestment. The liabilities also grew, with current liabilities growing strongly and almost doubling, reflecting increased working capital requirements. Meanwhile, non-current liabilities grew moderately, suggesting Lucky is scaling without overextending.
Cash Flow Statement
| Cash Flows Statement PKR in Millions | ||||||
| Particulars | 2025 | 2024 | 2023 | 2022 | 2021 | 2020 |
| Net Cash from Operating Activities | 27,573 | 27,581 | 23,243 | 15,469 | 12,493 | 5,047 |
| Net Cash used in Investing Activities | 11,715 | (2,580) | (12,979) | (24,826) | (5,762) | (8,396) |
| Net Cash (Outflow)/Inflow from Financing | (7,581) | (18,620) | 245 | 12,209 | 4,022 | (1,667) |
| (Decrease)/Increase in Cash & Bank Balance | 31,706 | 6,381 | 10,509 | 2,852 | 10,752 | (5,016) |
| Cash & Cash Equivalents at Beginning of Year | 32,382 | 26,002 | 15,493 | 11,641 | 889 | 5,904 |
| Cash & Cash Equivalents at End of Year | 64,088 | 32,382 | 26,002 | 14,493 | 11,641 | 889 |
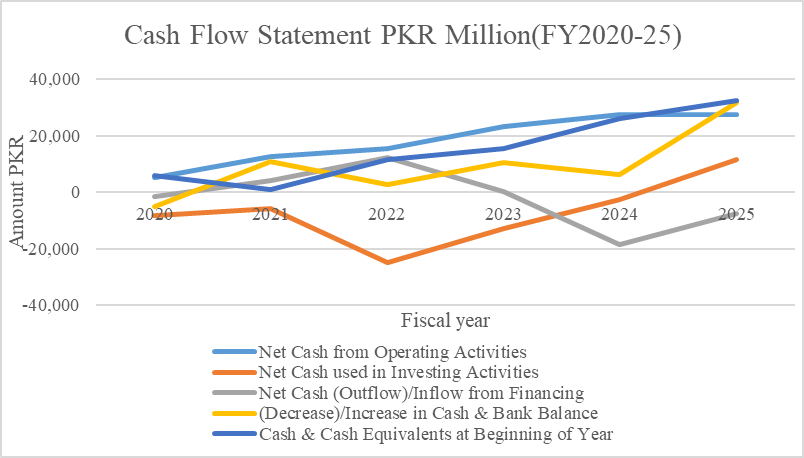
Lucky Cement’s cash generation profile over the last six years shows a company reaching its operational peak. Operating cash flow rose steadily, indicating stronger core performance and efficient cash generation, from PKR 5.0 billion to 27.5 billion in 2025.
In the early years, investment activities reached a high outflow of 24.8 billion in 2022. But by 2025, they reached an inflow of PKR 11.57 billion, suggesting lower capex and smart asset rationalization. Financing cash flows moved with the company’s capital strategy, high inflows in 2021–22, followed by outflows in 2024–25, likely tied to debt repayments or dividend distributions.
The payoff? A dramatic rise in year-end cash reserves. From mere PKR 0.9 billion to PKR 64 billion by 2025. That’s not liquidity alone; it’s room to breathe for expansion, resilience, and reinvestment.
Ratio Analysis (2020–2025)
Profitability Ratios
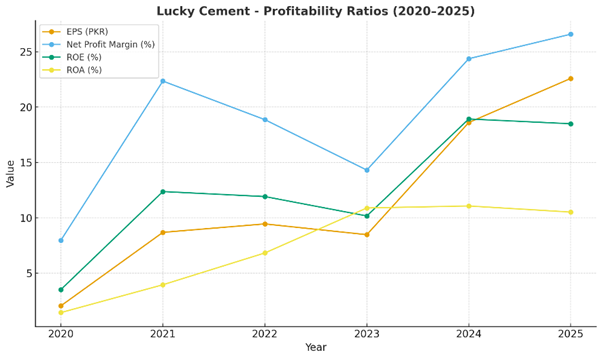
Earnings Per Share (EPS)
| Particulars | UoM | 2025 | 2024 | 2023 | 2022 | 2021 | 2020 |
| EPS | PKR | 22.59 | 18.61 | 8.49 | 9.46 | 8.70 | 2.07 |
EPS grew more than tenfold in six years, underscoring LUCK’s powerful earnings momentum. The surge after 2022 reflects structural cost savings and demand recovery.
Net Profit Margin (NPM)
| Particulars | UoM | 2025 | 2024 | 2023 | 2022 | 2021 | 2020 |
| Net Profit Margin | % | 26.58 | 24.37 | 14.32 | 18.87 | 22.35 | 7.99 |
Margins climbed steadily, peaking at 26.6% in 2025. This is exceptional for cement and reflects LUCK’s efficiency in managing fuel, energy, and raw material costs.
Return on Equity (ROE)
| Particulars | UoM | 2025 | 2024 | 2023 | 2022 | 2021 | 2020 |
| Return on Equity | % | 18.50 | 18.93 | 10.18 | 11.93 | 12.38 | 3.54 |
ROE improved from just 3.5% in 2020 to nearly 19% by 2025, placing LUCK in the top tier of PSX-listed industrials for value creation.
Return on Assets (ROA)
| Particulars | UoM | 2025 | 2024 | 2023 | 2022 | 2021 | 2020 |
| Return on Assets | % | 10.53 | 11.08 | 10.90 | 6.84 | 3.97 | 1.46 |
ROA shows efficient asset utilization, rising from 1.5% to over 10%. For a capital-intensive cement producer, this signals outstanding operational efficiency.
Leverage Ratios
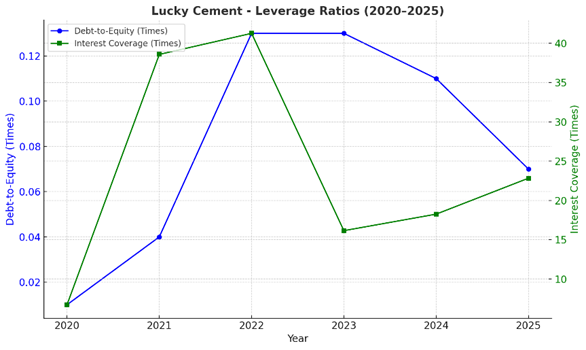
Debt-to-Equity Ratio (Book Value)
| Particulars | UoM | 2025 | 2024 | 2023 | 2022 | 2021 | 2020 |
| Debt-to-Equity | Times | 0.07 | 0.11 | 0.13 | 0.13 | 0.04 | 0.01 |
LUCKY maintained minimal leverage throughout six years, keeping D/E well below 0.15×. Its conservative balance sheet provides resilience against interest rate shocks and enhances Shariah compliance.
Interest Coverage Ratio
| Particulars | UoM | 2025 | 2024 | 2023 | 2022 | 2021 | 2020 |
| Interest Coverage | Times | 22.83 | 18.26 | 16.16 | 41.25 | 38.57 | 6.74 |
Interest coverage is consistently strong, exceeding 20× in 2025. This demonstrates that LUCK’s profits comfortably cover finance costs, further confirming its low-risk financial structure.
Liquidity Ratios
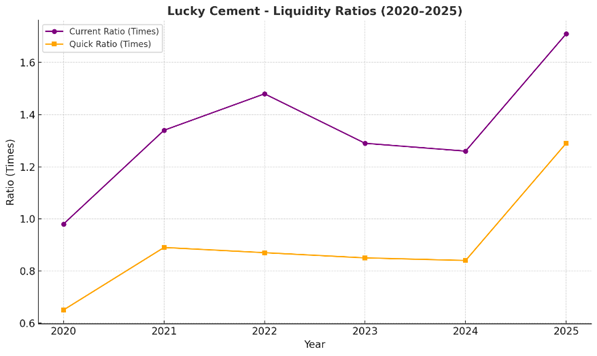
Current Ratio
| Particulars | UoM | 2025 | 2024 | 2023 | 2022 | 2021 | 2020 |
| Current Ratio | Times | 1.71 | 1.26 | 1.29 | 1.48 | 1.34 | 0.98 |
Liquidity has improved steadily, with the current ratio rising to 1.71× in 2025. LUCK comfortably covers short-term liabilities, reducing financial stress risk.
Quick Ratio
| Particulars | UoM | 2025 | 2024 | 2023 | 2022 | 2021 | 2020 |
| Quick Ratio | Times | 1.29 | 0.84 | 0.85 | 0.87 | 0.89 | 0.65 |
Quick ratio trends show enhanced liquidity quality. By 2025, LUCK had a 1.29× quick ratio, meaning it could meet obligations without relying on inventory liquidation.
Efficiency Ratios
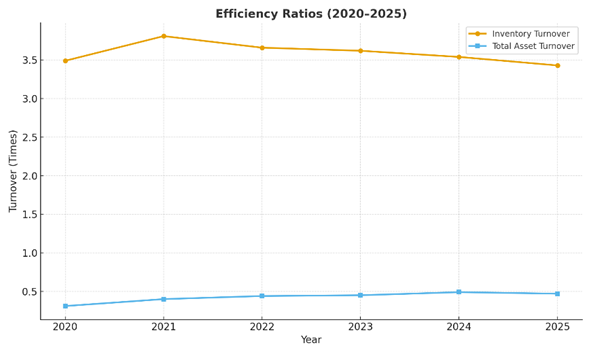
Inventory Turnover
| Particulars | UoM | 2025 | 2024 | 2023 | 2022 | 2021 | 2020 |
| Inventory Turnover | Times | 3.43 | 3.54 | 3.62 | 3.66 | 3.81 | 3.49 |
Inventory turnover remained stable around 3.5×, showing consistent demand and production cycles. LUCK has managed inventory efficiently without overstocking.
Total Asset Turnover
| Particulars | UoM | 2025 | 2024 | 2023 | 2022 | 2021 | 2020 |
| Total Asset Turnover | Times | 0.47 | 0.49 | 0.45 | 0.44 | 0.40 | 0.31 |
Asset turnover improved from 0.31× in 2020 to nearly 0.50× in 2024, before stabilizing at 0.47× in 2025. Higher turnover reflects better utilization of capacity and expansion efficiency.
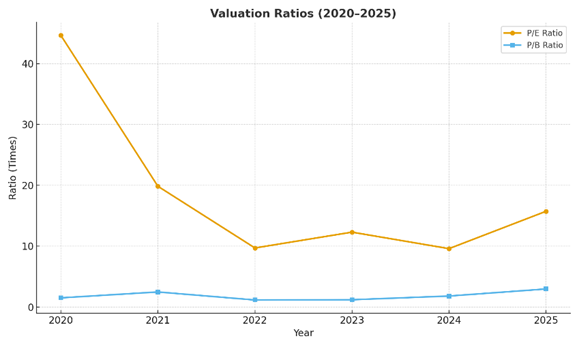
Valuation Ratios
Price-to-Earnings (P/E)
| Particulars | UoM | 2025 | 2024 | 2023 | 2022 | 2021 | 2020 |
| P/E Ratio | Times | 15.73 | 9.59 | 12.30 | 9.70 | 19.84 | 44.64 |
P/E compressed from 44× in 2020 to ~16× in 2025. This normalization reflects the shift from speculative valuations to earnings-driven pricing.
Price-to-Book (P/B)
| Particulars | UoM | 2025 | 2024 | 2023 | 2022 | 2021 | 2020 |
| P/B Ratio | Times | 2.96 | 1.80 | 1.19 | 1.15 | 2.47 | 1.50 |
By 2025, P/B touched 2.96×, showing strong investor confidence and a premium valuation relative to book value. The ratios’ cycles highlight how market optimism responds to sector and macroeconomic shifts.
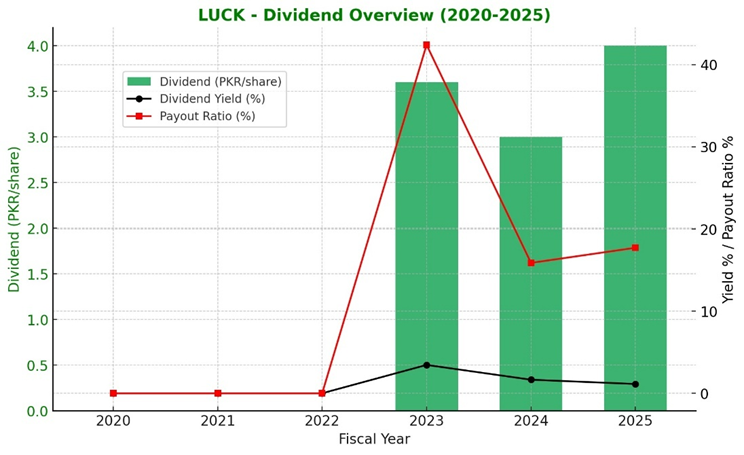
Dividend & Payout History
| UoM | 2020 | 2021 | 2022 | 2023 | 2024 | 2025 | |
| Cash Dividend | Rupee | 0 | 0 | 0 | 3.6 | 3 | 4 |
| Dividend Yield | % | 0 | 0 | 0 | 3.45% | 1.65% | 1.13% |
| Dividend Payout Ratio | % | 0 | 0 | 0 | 42.41% | 15.87% | 17.71% |
In the last six years, Lucky Cement’s dividend policy has shifted from caution to calculated generosity. From 2020 to 2022, the company held back on payouts, choosing to conserve capital during uncertain times and prioritize reinvestment. Then 2023 arrived, with a PKR 3.6 dividend and a daring 42.41% payout ratio, a clear signal of regained confidence and financial health.
But in 2024 and 2025, the company eased the payout ratios to 15.87% and 17.71%, respectively. The message? Sustainability matters. This change is a balance, rewarding shareholders while holding onto cash for long-term development, particularly as Lucky continues to deepen its investments in energy and infrastructure.
Risk & Risk Management
| Avg annual return (5 years) | 47% |
| Standard deviation | 0.607 |
| Sharpe ratio | 0.585 |
Lucky Cement reported an impressive 47% average annual return for over five years, having a moderate volatility (standard deviation of 0.607) and a Sharpe ratio of 0.585, a solid reward for the risk taken.
Aside from performance, the company runs a strong Enterprise Risk Management (ERM) system. It monitors key risks like inflation, fuel costs, and currency swings, while staying resilient through self-generated power, cybersecurity, and tight financial controls. Together, this smart mix of returns and risk management supports steady, long-term growth.
Industry & Market Position – Lucky Cement Limited
1. Market Share & Competition
Lucky Cement is Pakistan’s largest manufacturer of cement, with 15.3 million tons of capacity across plants in Karachi, Pezu, and international sites in Iraq and DR Congo. Its global exports reach Sri Lanka, Africa, and the Middle East, and combined with low-cost production and smart logistics, give it a clear edge over competitors like DG Khan and Bestway.
2. Sector Diversification & Strategic Role
As the flagship of Yunus Brothers Group, Lucky Cement benefits from deep industrial diversification. With interests in energy, automobile, chemicals, and more, it’s shielded from sector-specific risks. Key projects like the 660 MW coal plant, wind energy, and RDF systems reflect its sustainability push, while stakes in Lucky Motor and Lucky Core Industries reinforce its role in driving Pakistan’s industrial growth.
3. Regulatory Environment & Policy Alignment
Lucky Cement, listed on the Pakistan Stock Exchange (PSX) and recognized as Shariah-compliant, operates under the regulatory oversight of SECP and NEPRA. Its commitment to ESG-focused energy initiatives, coupled with a prudent financial strategy, enhances policy alignment, long-term resilience, and investor confidence.
4. Competitive Positioning
With a debt-to-equity ratio of only 0.07× and an interest coverage of 22.83×, Lucky Cement demonstrates its financial strength. It’s not just maintaining growth, but doing so with discipline and resilience.
Alongside its size, export reach, and diversified industrial ties, Lucky Cement isn’t merely constructing buildings; it’s laying down the strategic blocks of Pakistan’s industrial future.
Management & Governance – Lucky Cement Limited
1. Leadership Structure
Lucky Cement is led by Chairman Muhammad Sohail Tabba and CEO Muhammad Ali Tabba, supported by a well-rounded board of directors. The board includes executives, non-executive, and independent directors. Key figures like Masood Karim Shaikh, Khawaja Iqbal Hassan, and Shabbir Hamza Khandwala contribute to strategic oversight and governance depth.
2. Executive Management
The executive team runs operations across cement, energy, chemicals, and automotive sectors, including international projects in Iraq and DR Congo. Strategic subsidiaries such as Lucky Electric Power Company and Lucky Motor Corporation show how the company works as part of a larger, connected industrial group.
3. Governance Framework
Lucky Cement follows Pakistan’s corporate governance code and has a dedicated committee for audit and HR & remuneration. These are led by independent directors and ensure strong oversight of financial reporting, executive compensation, and risk management.
4. Ethical Culture & Transparency
The company promotes responsible growth through its Shariah-compliant certification, conservative financial approach, and ESG-friendly initiatives like Waste Heat Recovery Systems (WHRS) and Refuse-Derived Fuel (RDF). Its governance methodology blends operational discipline with sustainability, building long-term trust with investors.
News & Announcements – Lucky Cement Limited
1. Stock Split & Market Capitalization
In June 2025, Lucky Cement carried out a 5-for-1 stock split, reducing the face value from PKR 10 to PKR 2 per share. This increased the number of ordinary shares from 92.36 million to 461.80 million. After Regulatory approvals in July, Lucky’s market capitalization crossed PKR 500 billion, a milestone that reflects strong investor trust and forward momentum.
2. International Expansion & Export Milestones
Lucky Cement expanded its international footprint by adding a second 1.82 MTPA clinker line at its Samawah, Iraq joint venture, pushing total capacity to over 21 MTPA. With record monthly exports of cement and clinker, Lucky has established itself as a regional export leader and important contributor to Pakistan’s export of industrial prowess overseas.
3. Largest Battery Energy Storage System in Pakistan
Lucky Cement is setting a national benchmark by installing a 20.7 MW / 22.7 MWh battery energy storage system (BESS) at its Pezu solar plant, the largest of its kind in Pakistan. This system will help smooth out solar energy supply and cut down reliance on fossil fuels, pushing forward the company’s clean energy goals.
4. Commercial Operation of Wind Power
On October 22, 2024, Lucky Cement launched its 22.8 MW captive wind power project at the Karachi plant. This is a major move towards energy independence and deeper integration of renewables into its operations.
Conclusion
In 2025, Lucky Cement is doing more than just growing. It is changing how it works and where it’s headed. With bigger global operations, smart energy projects, and careful financial planning, the company continues to support Pakistan’s infrastructure and industrial progress.
Its balanced dividend policy, strong leadership, and future-focused investments show that Lucky Cement is built to last. It’s not just making cement; it’s building a strong foundation for the future, both in business and in the country.
No responses yet