
Gold and silver have long served as benchmarks of economic stability, investment sentiment, and industrial demand. Their prices are not simply the result of supply and demand. They reflect macroeconomic dynamics, market liquidity, geopolitical developments, industrial consumption, and investor psychology. Over the past two decades, both metals have experienced periods of dramatic appreciation, volatility, and record-breaking highs.
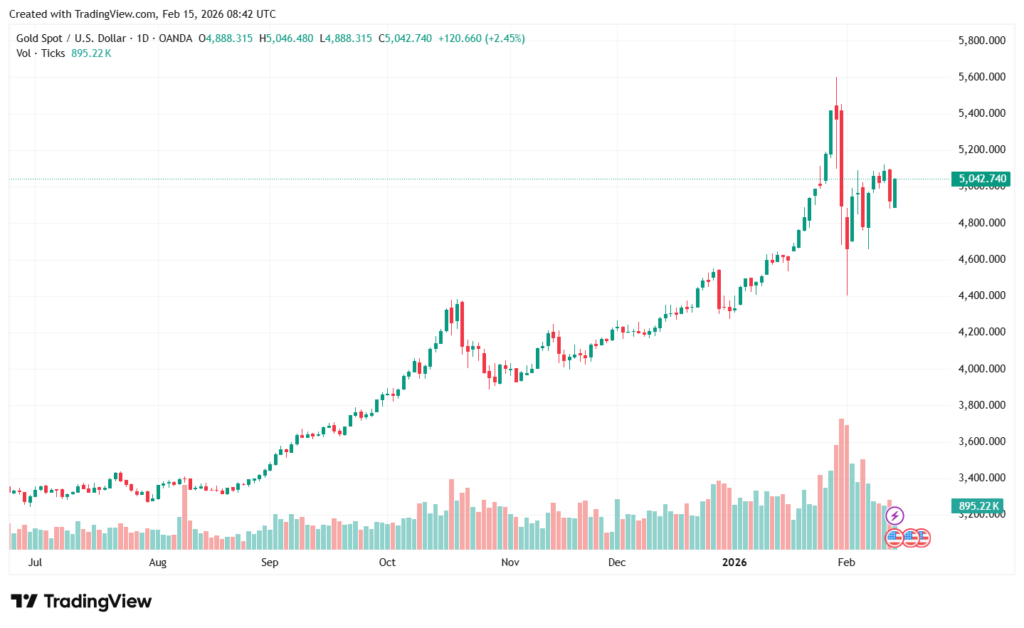
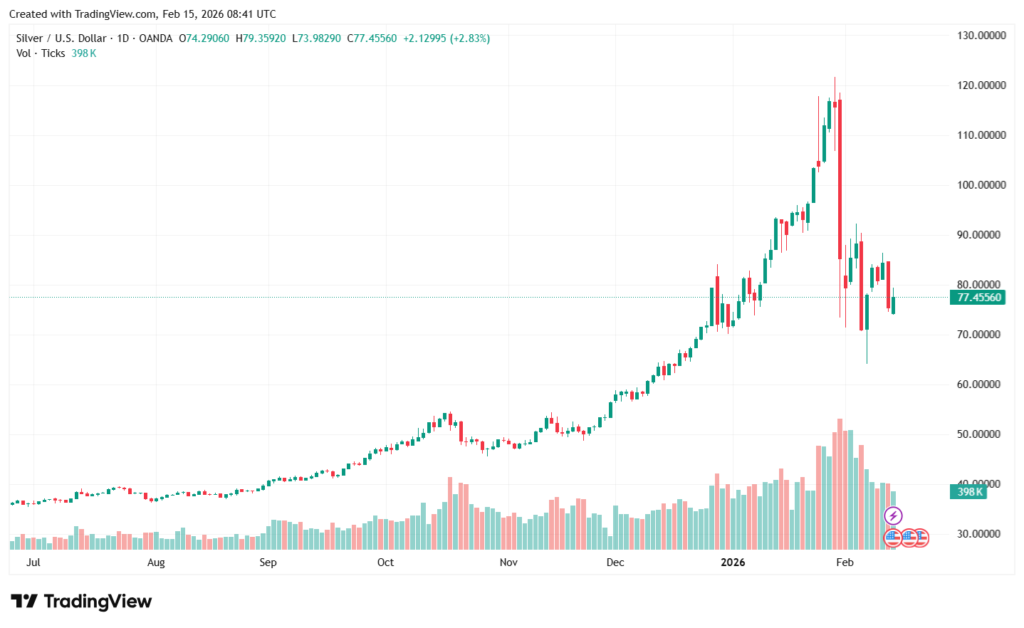
Recent price trends, particularly in 2025–2026, have drawn attention globally. Gold surged beyond $5,000 per ounce, while silver oscillated between $80 and $121 per ounce, illustrating both metals’ sensitivity to macroeconomic conditions and investor positioning.
Long-Term Price Evolution: Gold & Silver (2000–2026)
Gold: Structural Growth with Crisis-Driven Momentum
Over the last two decades, gold has shown a clear long-term increasing trend, fueled by economic instability, monetary policy moves, and its status as a safe-haven asset. During a period of global stability in 2000, gold prices traded around $300/oz. However, the 2008–2009 financial crisis caused prices to spike near $1,000/oz as investors sought protection from quantitative easing and systemic risk. The surge peaked around $1,800/oz in 2011 due to sovereign debt concerns and further monetary stimulus. This was followed by many years of consolidation as economic circumstances improved. The costs fluctuated around $1,770 to $2,050/oz in 2020 as a result of liquidity injections and inflation concerns triggered by the COVID-19 pandemic. Geopolitical concerns and ongoing inflation caused prices to rise beyond $2,200/oz by 2023–2024. Gold prices soared between $3,800 to $5,000/oz in 2025-2026, because of fundamental supply-demand imbalances, significant central bank purchasing, and increased global uncertainty. Overall, gold’s history shows cyclical volatility within a sustained long-term bull trend influenced mainly by real interest rates and risk sentiment.
Silver: Volatile Growth Driven by Industrial and Investment Demand
Since silver serves as both an industrial and a precious metal, its price evolution has been more volatile. Silver rose with gold during the early 2000s trading cycle, reaching over $20/oz in 2010. It saw a dramatic increase in 2011 due to inflation worries and speculative inflows. However, it then corrected when markets stabilized. Prices fluctuated between 2013 and 2019 in a range that was strongly correlated with industrial activity worldwide. In 2020, stimulus efforts and recovery optimism pushed silver to roughly $24 per ounce. Strong demand from solar energy, electric cars, and electronics, together with supply shortages, fueled more advances starting in 2023. In 2025–2026, silver saw a broad trading expansion on average between $35 and $90 per ounce. It then saw a strong increase, reaching a peak of about $121 per ounce, before experiencing a significant decline due to profit-taking, margin pressures, and changing market sentiment. This sharp increase and decline highlight silver’s higher volatility in comparison to gold, which is a result of its lower market size and more susceptibility to speculative activity and industrial cycles.
Macroeconomic Drivers
Gold and silver prices are highly sensitive to macroeconomic variables such as real interest rates, central bank reserve activity, geopolitical uncertainty, and global liquidity conditions.
Real Yields:
Historically, the price of gold and silver has been inversely correlated with real yields, which are defined as nominal interest rates adjusted for inflation. When real rates fall or become negative, the opportunity cost of owning non-yielding assets like gold and silver reduces, making them more appealing to investors. In 2025, anticipation of monetary easing by the US Federal Reserve contributed to lower real rates, which supported precious metals’ strong upward trend. According to market reports, cooling U.S. inflation data and growing rate cut expectations were key factors behind gold and silver reaching record levels during this period.
Central Bank Purchases:
Central bank purchases have provided significant structural support for gold prices. The World Gold Council report that in 2025, worldwide central banks bought more than 1,100 tonnes of gold, driven mostly by demand from emerging nations in the Middle East, Asia, and Eastern Europe. This persistent regulatory demand withdrew considerable bullion from the market, limiting commercial supply and promoting long-term price increase. Central banks, on the other hand, do not hold large quantities of silver. Its price is mostly affected by industrial demand, specifically from solar panels, electric cars, electronics, and other manufacturing uses, as well as investment flows into ETFs and futures. This distinction clarifies why silver usually shows higher short-term volatility than gold.
Geopolitical and Liquidity Factors:
The demand for precious metals in safe havens is driven by macroeconomic risks, trade uncertainty, and geopolitical tensions. In 2025, periods of uncertainty, such as regional wars and frictions in global commerce, led to higher allocations to gold and silver. Short-term volatility increased by the surge in flows into ETFs and futures markets brought on by the abundance of global liquidity that followed the pandemic-era stimulus. Silver’s lower market size and tighter relationship to industrial demand contributed to its percentage swings in comparison to gold, notably during the steep surge and subsequent drop in early 2026, when silver peaked at $121 per ounce.
Supply and Demand Dynamics
The recent fluctuations in the price of gold and silver are not only due to speculation. In 2025–2026, structural supply restrictions and strong and shifting demand patterns were major factors in driving prices to all-time highs.
Tightness in the Gold Market and Supply
The global gold supply is generally stable and slow-growing. According to the World Gold Council, yearly mine output has stayed around record levels at approximately 3,600-3,700 tons, while total supply, including recycling, is over 5,000 tons per year. However, due to a lack of fresh finds, increased extraction costs, and diminishing ore grades, mine output growth has remained moderate.
Although recycling makes a significant contribution to supply, it cannot fundamentally replace mine output and is price-responsive. The supply of scrap only gradually rises, even during times of high prices.
In the meantime, central banks have kept their gold holdings at historically high levels, surpassing 1,000 tons each year in recent years. This official sector demand lowers the amount of freely traded supply and takes large quantities out of the open market. Prices often increase when stable but inelastic supply and high investment demand coexist. This discrepancy has contributed to the price of gold rising from below 2,000 dollars per ounce in 2023 to above 3,800 dollars in 2025 and above 5,000 dollars in early 2026.
In summary, the current strength of gold is a result of both sustained institutional and safe-haven demand and restricted supply increase.
Silver Supply Constraints and Structural Deficits
The supply structure of silver is very different from that of gold. Around 70%-80% of the silver produced worldwide is a byproduct of mining for copper, lead, and zinc. This means that silver supply is mostly determined by base metal mining activities rather than silver pricing. Production cannot grow rapidly until base metal output rises, even in the event of a substantial spike in silver prices.
According to the Silver Institute, worldwide silver mine output has averaged over 835 million ounces per year, with recycled silver reaching roughly 194 million ounces in 2025, the highest level in more than a decade. Recycling has increased, but overall supply has not kept up with demand.
For several years in a row, the silver market has had structural deficits, which indicate that total demand exceeds total supply. Industrial demand alone accounted for more than half of global silver usage, driven by solar photovoltaic installations, electric cars, electronics, and sophisticated manufacturing. Industrial consumption hit all-time highs in 2024–2025 as green energy expansion picked up speed.
This ongoing shortage of supplies greatly increased price fluctuations. During the early expansion, silver surged from the mid-20 dollar range to above $35 per ounce before rising drastically and peaked around 121 dollars per ounce in early 2026. Any increase in demand causes inflated price reactions since the market is smaller than that of gold and supply is more inflexible. Rather than a significant rise in supply, the steep decline following the high was the result of speculative unwinding and profit-taking.
Regional Focus: Pakistan
Pakistan’s precious metals market closely tracks international price movements, but domestic prices are further amplified by currency depreciation and import-related premiums. Since gold and silver are largely imported commodities, fluctuations in the Pakistani rupee against the US dollar significantly influence local rates. Even when global prices stabilize, rupee weakness can push domestic prices higher.
In January 2026, gold (24K) was recorded at approximately Rs 489,362 per tola, while silver traded near Rs 9,782 per tola. These elevated levels reflect not only strong global bullion prices but also exchange rate pressures and local demand conditions. Seasonal buying during wedding periods and inflation-hedging behavior also contribute to upward price momentum.
Silver’s globally driven industrial surge has translated into sharper domestic volatility compared to gold. Because silver prices react more aggressively to global industrial demand and speculative flows, Pakistani markets experience wider swings in retail rates. Overall, local precious metal prices remain highly sensitive to global trends, currency movements, and domestic economic conditions.
Risks and Considerations
Despite recent excellent performance, the gold and silver markets are nevertheless vulnerable to a number of negative concerns. Real interest rate increases are a major issue. When real rates rise, the opportunity cost of keeping non-yielding assets like gold and silver rises, possibly lowering their safe-haven attractiveness and pushing up prices. Shocks from the supply side are also unpredictable. Geopolitical tensions, trade restrictions, or interruptions in key mining regions might either compress supply and raise prices or, conversely, stabilize markets if output suddenly surges.
Industrial substitution poses a structural concern, particularly for silver. Technological developments might reduce the use of silver in solar panels or electronics, limiting long-term demand growth. Furthermore, both metals are also prone to speculative corrections. Rapid inflows into ETFs and futures markets can amplify rallies, but profit-taking and position unwinding may trigger sharp short-term reversals.
Future possibilities
During moments of economic instability, central bank holdings and sustained demand for portfolio diversification are expected to provide underlying support for gold. Due to its dual function as an investment asset and an industrial input, silver’s outlook is still more cyclical and erratic. Overall, future price changes will be determined by the combination of macroeconomic factors, industry demand patterns, and investor mood.
Conclusion
The current gold and silver price movements are influenced by macroeconomic factors, supply-demand imbalances, and investment positioning. While silver’s price is more volatile due to industrial demand and speculative activity, gold continues to be a safe-haven asset supported by central bank purchases and low real rates. Because of import expenses and currency devaluation, regional markets like Pakistan intensify these global patterns.
Structured research of historical patterns, macroeconomic factors, and supply-demand fundamentals enables a data-driven knowledge of the current dynamics affecting precious metal pricing.
Discover More: The truth about Risk and Return in Pakistan
One response
ketocare Pretty! This has been a really wonderful post. Many thanks for providing these details.