

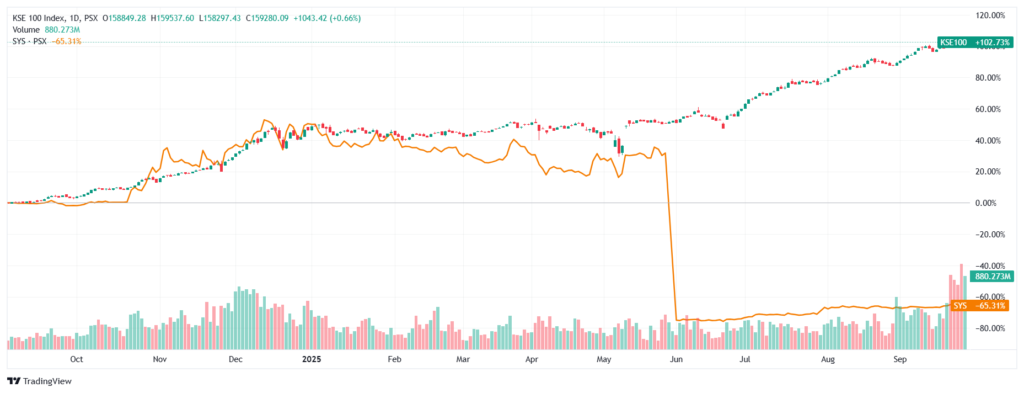
In Pakistan’s fast-growing IT and technology services landscape, Systems Limited (SYS) has emerged as a pioneer and leader. Listed on the Pakistan Stock Exchange (PSX), SYS represents one of the country’s most successful technology companies, recognized for its software exports, digital transformation services, and global client base. With a presence in North America, the Middle East, and Europe, SYS offers investors exposure to the growth of Pakistan’s IT industry and the global outsourcing boom.
Company overview
Systems Limited (SYS), one of the biggest providers of IT services and solutions in Pakistan, was established in 1977 and has a significant presence in North America, the Middle East, Africa, and Asia-Pacific. Leading the way in technology worldwide, SYS focuses on business process outsourcing (BPO), cloud services, artificial intelligence, digital transformation, and enterprise solutions. Serving a wide range of sectors, such as banking, financial services, telecom, retail, and government, the company positions itself as a reliable digital partner for scalability and innovation.
With its numerous appearances on Forbes Asia’s “Best Under a Billion” list, SYS has established a reputation for steady growth over the years. Its international footprint and diversified service portfolio provide resilience against local market challenges. With a focus on sustainable expansion, talent development, and cutting-edge technologies, SYS continues to be a pioneer of Pakistan’s IT exports, driving value creation for shareholders while strengthening the country’s global technology footprint.
Discover the PSX Archives for more!
Financial Performance Overview (2019–2025)
Income Statement
| Income Statement(consolidated) PKR in Millions | |||||||
| 2025 | 2024 | 2023 | 2022 | 2021 | 2020 | 2019 | |
| Revenue | 36,739 | 67,473 | 53,435 | 31,760 | 15,304 | 9,877 | 7,536 |
| Cost of Revenue | -27,453 | -51,437 | -39,590 | -23,062 | -10,277 | -6,607 | -5,166 |
| Gross Profit | 9,285 | 16,036 | 13,846 | 8,698 | 5,027 | 3,270 | 2,369 |
| All Expenses* | -4,173 | -7,886 | -6,034 | -3,335 | -1,858 | -1,156 | -1,040 |
| Operating Profit | 5,111 | 8,150 | 7,811 | 5,363 | 3,169 | 2,114 | 1,330 |
| Other Income (incl. gains) | 820.8 | 726 | 3,194 | 2,230 | 1,469 | 235 | 318 |
| All Other Expenses† | -586 | -584 | -1,637 | -612 | -205 | -67 | -47 |
| Profit Before Tax (PBT) | 5,344 | 7,816 | 8,784 | 6,981 | 4,434 | 2,282 | 1,601 |
| Tax | -192 | -356 | -95 | -352 | -54 | -118 | -33 |
| Net Profit | 5,152 | 7,460 | 8,689 | 6,630 | 4,380 | 2,164 | 1,568 |
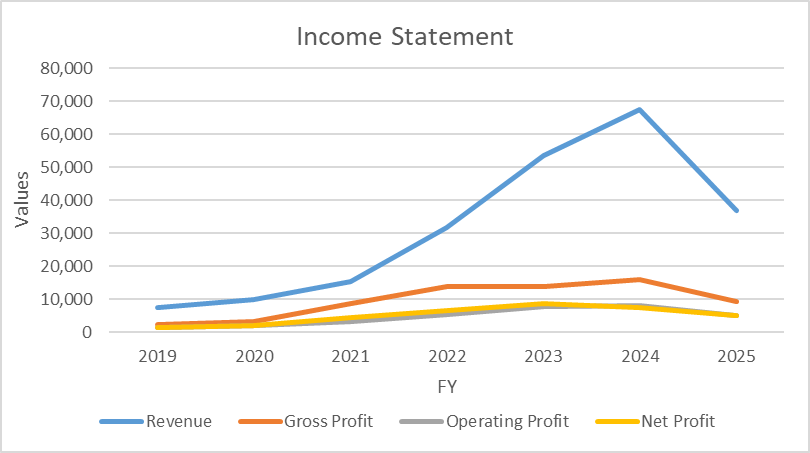
Systems Limited has demonstrated remarkable financial growth over the past six years. Revenue surged from PKR 7.5 billion in 2019 to PKR 67.5 billion in 2024, reflecting consistent global expansion and strong demand for digital transformation services. In the first half of 2025, revenue stood at PKR 36.7 billion, showing some moderation due to sectoral headwinds and margin pressures. Net profit peaked at PKR 8.7 billion in 2023 but softened in 2024 and early 2025 as rising costs weighed on earnings. Even so, profitability remains significantly higher than 2019 levels. This resilience highlights SYS’s ability to sustain growth through a diversified global portfolio, robust client relationships, and its strategic positioning in the technology services sector.
Balance Sheet
| Balance Sheet (unconsolidated) | ||||||
| 2025 | 2024 | 2023 | 2022 | 2021 | 2020 | |
| ASSETS | ||||||
| Non-current assets | 12,907,267,531 | 12,980,888,156 | 12,954,410,936 | 10,462,747,651 | 3,914,118,859 | 1,967,445,306 |
| Current assets | 33,541,258,098 | 30,356,375,277 | 23,362,885,786 | 16,375,832,839 | 11,326,755,269 | 9,508,481,944 |
| TOTAL ASSETS | 46,448,525,629 | 43,337,263,433 | 36,317,296,722 | 26,838,580,490 | 15,240,874,128 | 11,475,927,250 |
| EQUITY AND LIABILITIES | ||||||
| Share capital and reserves | 35,515,484,986 | 32,883,536,730 | 27,713,527,674 | 20,182,436,558 | 10,473,329,516 | 7,976,013,326 |
| Non-current liabilities | 220,907,736 | 292,081,761 | 454,079,275 | 461,451,732 | 319,992,499 | 397,218,670 |
| Current liabilities | 10,712,132,907 | 10,161,644,942 | 8,149,689,773 | 6,194,692,200 | 4,447,552,113 | 3,102,695,254 |
| TOTAL EQUITY AND LIABILITIES | 46,448,525,629 | 43,337,263,433 | 36,317,296,722 | 26,838,580,490 | 15,240,874,128 | 11,475,927,250 |
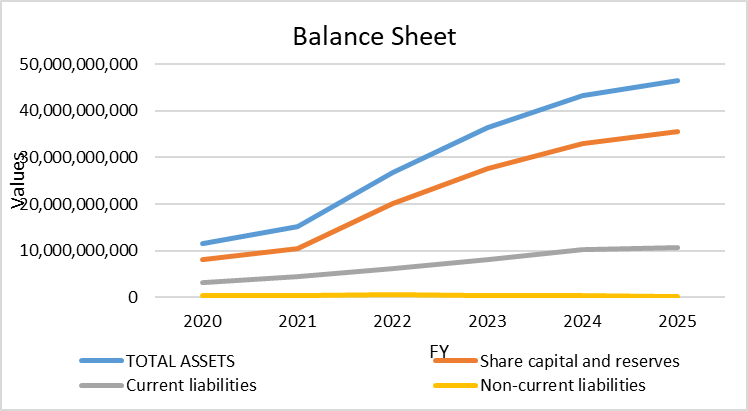
Systems Limited’s balance sheet highlights strong financial health and consistent expansion. Total assets increased from PKR 11.5 billion in 2020 to PKR 46.4 billion in 2025, driven largely by growth in current assets, which rose to PKR 33.5 billion as the company scaled its operations. Equity has remained the dominant funding source, climbing to PKR 35.5 billion in 2025, reflecting robust retained earnings and limited reliance on external debt. Non-current liabilities declined over time, while current liabilities grew moderately in line with business expansion, indicating prudent working capital management. The company’s low leverage and high equity ratio underline financial resilience, giving SYS flexibility to withstand sectoral pressures while sustaining investments in technology, talent, and international market diversification.
Cash Flows Statement
| Cash Flows Statement (consolidated) | ||||||
| 2025 | 2024 | 2023 | 2022 | 2021 | 2020 | |
| Net cash generated from operating activities | 1,982,424,774 | 4,536,790,684 | 2,374,223,337 | 1,015,482,464 | 2,623,191,790 | 2,344,630,402 |
| Net cash generated from / (used in) investing activities | 945,735,073 | -1,961,638,159 | 861,477,876 | -1,593,074,853 | -3,829,198,642 | -2,052,228,013 |
| Net cash used in financing activities | -1,783,276,692 | -2,411,853,640 | -2,403,077,374 | -540,296,784 | 981,689,392 | 1,166,444,901 |
| Net increase/decrease in cash and cash equivalents | 1,144,883,155 | 163,298,885 | 832,623,839 | -1,117,889,173 | -224,317,460 | 1,458,847,290 |
| Net foreign exchange difference | 25,509,753 | -15,572,764 | 20,779,688 | 53,845,273 | 299,171,614 | 10,104,923 |
| Cash and cash equivalents at the beginning of the period | 1,489,699,594 | 1,441,973,473 | 588,569,946 | 1,652,613,846 | 1,577,759,692 | 1,516,152,353 |
| Cash and cash equivalents at the end of the period | 2,660,092,502 | 1,589,699,594 | 1,441,973,473 | 588,569,946 | 1,652,613,846 | 2,985,104,566 |
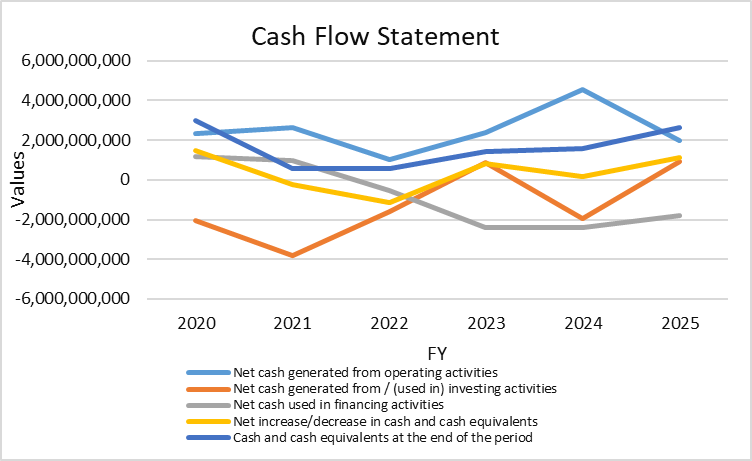
Systems Limited’s cash flow trends reflect shifting liquidity dynamics. Operating cash flows remained positive, though they declined from PKR 4.5B in 2024 to PKR 2.0B in 2025, signaling margin pressure and slower collections. Investing activities turned positive in 2025 (PKR 946M) after several years of heavy outflows, reflecting reduced capital expenditure and strategic discipline. Financing cash flows stayed negative, with PKR 1.8B outflow in 2025, mainly from dividend payouts and debt servicing, showing the company’s commitment to rewarding shareholders while relying less on leverage. Net cash improved significantly to PKR 1.1B in 2025, lifting closing balances to PKR 2.7B. Overall, SYS maintains strong liquidity despite profitability compression, supported by disciplined investment and financing strategies, ensuring resilience in volatile sectoral conditions.
Ratio Analysis
1. Profitability Ratios
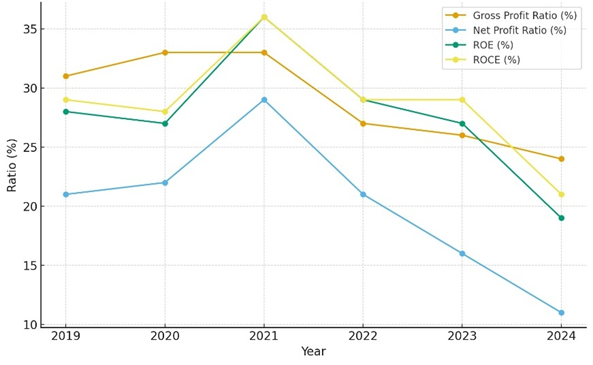
| Ratio | 2024 | 2023 | 2022 | 2021 | 2020 | 2019 |
| Gross Profit Ratio | 24% | 26% | 27% | 33% | 33% | 31% |
| Net Profit Ratio | 11% | 16% | 21% | 29% | 22% | 21% |
| Return on Equity (ROE) | 19% | 27% | 29% | 36% | 27% | 28% |
| Return on Capital Employed (ROCE) | 21% | 29% | 29% | 36% | 28% | 29% |
SYS’s margins and returns peaked in 2021 but have been on a steady decline since then. ROE fell from 36% (2021) to 19% (2024), while net margins dropped sharply to just 11% in 2024. This shows pressure on both operational efficiency and bottom-line profitability.
2. Capital Structure Ratios
| Ratio | 2024 | 2023 | 2022 | 2021 | 2020 | 2019 |
| Debt-to-Equity | 0.07 | 0.07 | 0.14 | 0.23 | 0.19 | 0.12 |
| Interest Coverage | 17.5 | 9.0 | 18.6 | 26.1 | 31.7 | 28.28 |
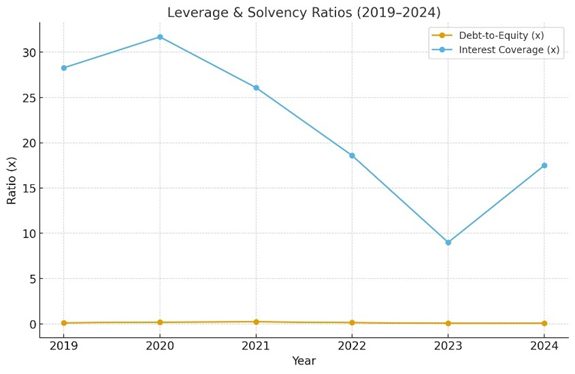
Debt levels remain minimal, with debt-to-equity down to 0.07 in 2024, signalling very low leverage. Interest coverage, though still high, has become more volatile, showing that profitability swings directly affect debt-servicing capacity.
3. Liquidity Ratios
| Ratio | 2024 | 2023 | 2022 | 2021 | 2020 | 2019 |
| Current Ratio | 2.52 | 2.18 | 1.81 | 2.52 | 3.06 | 3.32 |
| Quick Ratio | 1.81 | 1.52 | 1.48 | 2.21 | 2.58 | 2.65 |
| Cash to Current Liabilities | 0.48 | 0.52 | 0.43 | 0.54 | 0.96 | 0.91 |
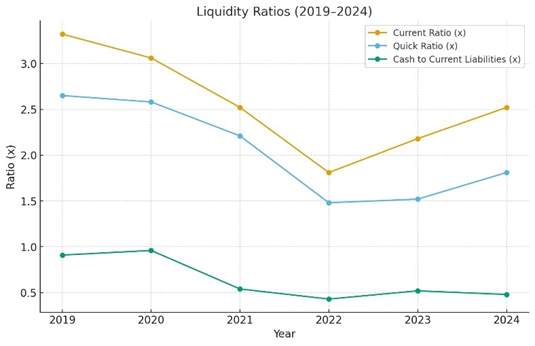
Liquidity has declined compared to 2019–2020 but remains healthy. Current ratio rebounded to 2.52 in 2024 after a dip in 2022, indicating improved short-term solvency. However, the cash ratio (0.48 in 2024) suggests reliance on non-cash assets to cover obligations.
4. Valuation & Investment Ratios
| Ratio | 2024 | 2023 | 2022 | 2021 | 2020 | 2019 |
| EPS Basic | 25.55 | 29.86 | 23.61 | 16.21 | 8.08 | 5.84 |
| EPS Diluted | 25.37 | 29.66 | 23.45 | 16.10 | 8.01 | 5.82 |
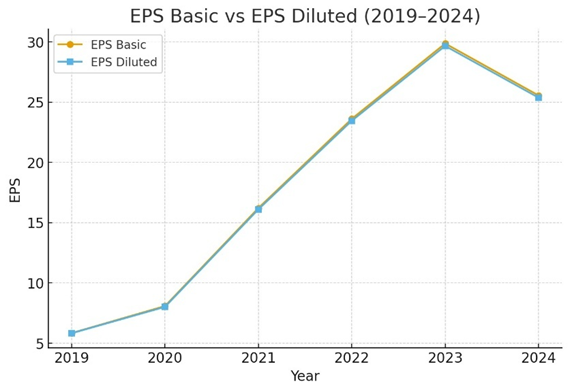
EPS has shown strong long-term growth, nearly quadrupling from PKR 5.8 in 2019 to PKR 25.5 in 2024. However, 2024 witnessed a decline from the 2023 peak, reflecting margin compression and weaker profitability despite revenue strength.
Dividend Policy & Payout Ratio
Dividend Per Share (DPS) and Dividend Payout Ratio
| Year | 2024 | 2023 | 2022 | 2021 | 2020 |
| DPS (PKR) | 4.40 | 4.37 | 3.64 | 1.74 | 1.09 |
| Payout Ratio | 29% | 20% | 22% | 20% | 20% |
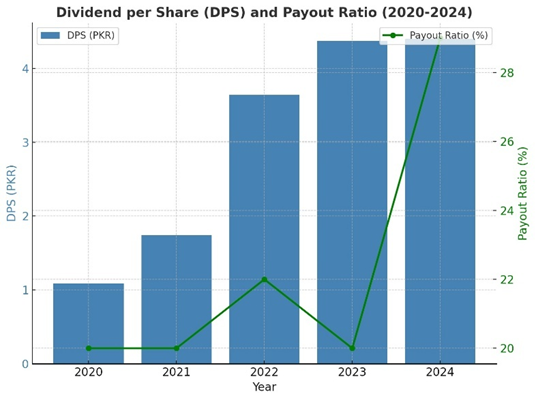
SYS has shown a progressive dividend policy over the last five years, rewarding shareholders with consistent growth in payouts. The Dividend Per Share (DPS) increased from PKR 1.09 in 2020 to PKR 4.40 in 2024, reflecting more than a fourfold rise. This signals management’s confidence in stable cash flows and profitability.
The payout ratio remained conservative at 20–22% between 2020 and 2023, allowing the company to retain significant earnings for reinvestment. However, in 2024 the payout ratio rose sharply to 29%, indicating a stronger emphasis on shareholder returns.
This shift highlights SYS’s transition toward a more mature phase, where strong earnings growth is now complemented by higher dividend distributions. For investors, this makes SYS attractive not only for capital appreciation but also for steady and growing income streams.
Risk Analysis
| Metric | Value | Interpretation |
| Avg. Annual Return (5 years) | 77% | Strong historical growth |
| Standard Deviation | 1.555 | High return volatility |
| Sharpe Ratio | 0.424 | Moderate risk-adjusted return |
| Beta | 0.94 | Moves with market, slightly lower risk |
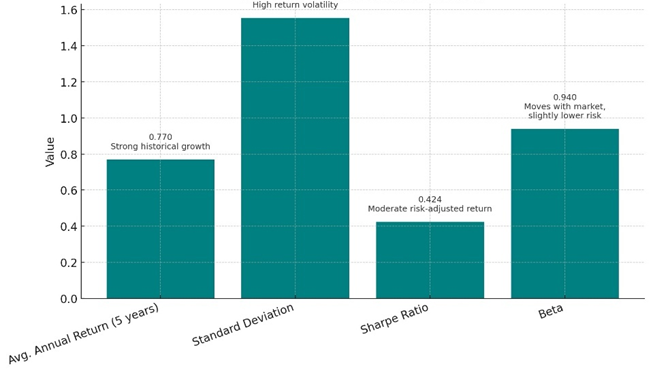
Systems Limited has exhibited exceptional growth, averaging 77% annual returns over the last five years. However, this growth comes with risk factors. The standard deviation of 1.555 highlights significant volatility in returns, exposing investors to sharp price swings. The Sharpe ratio of 0.424 reflects modest risk-adjusted performance, implying that while returns are attractive, they are not proportionate to the volatility. With a beta of 0.94, SYS largely mirrors overall market movements, making it less volatile than high-beta tech peers but still exposed to systematic risks.
Beyond market risks, SYS faces currency risks due to its global exposure, regulatory and compliance risks in IT outsourcing, and technological disruption risks as innovation cycles shorten. Additionally, liquidity risks in the Pakistani equity market may amplify volatility during downturns. Despite these challenges, SYS’s diversified client base and global footprint enhance resilience, though prudent investors must weigh risks against its strong growth trajectory.
Industry & Market Position – Systems Limited
Market Share & Global Reach
Systems Limited is Pakistan’s top IT exporter, with around 87% of its revenue coming from international markets like North America, Europe, the Middle East, and the Asia Pacific. It’s recognized as a global system integrator, working with Fortune 500 clients and delivering enterprise solutions across banking, telecom, retail, pharma, and the public sector.
Sector Diversification
SYS offers a wide range of services, including AI, cloud, data, consulting, IT outsourcing, and BPO. Its AI-first strategy is powered by platforms like GenAI Studio, which helps clients build and scale generative AI solutions, and MEA Process Platform, which drives automation and process optimization across industries.
Strategic Role in National Development
The company’s export-led growth supports Pakistan’s tech economy. It’s expanding delivery centres in tier-2 cities in India and Pakistan, investing in solar infrastructure, and training its workforce in emerging technologies. These efforts align with sustainability goals and digital transformation across regions.
Competitive Positioning
SYS competes with specialized tech firms but stands out through innovation, operational efficiency, and long-term client relationships. With 93% recurring revenue and over 3,250 certified professionals across Microsoft, Temenos, AWS, and more, it maintains a strong edge in global delivery and enterprise tech.
Management & Governance – Systems Limited
Leadership Structure
SYS is led by Atif Peer (Group CEO & MD) and Aazaz Hussain (Chairman), supported by a diverse Board of Directors. Independent members like Zubyr Soomro, Omar Saeed, and Mehm Rahman bring strategic oversight and governance depth.
Executive Management
Key roles include Roohi Khan (Chief Financial Officer), Salman Naveed (Head of Internal Audit), and Hasan Waleed Majeed (Company Secretary). Each subsidiary operates under specialized leadership, ensuring focused execution across business units.
Governance Framework
The company follows Pakistan’s corporate governance regulations, with active committees for audit and HR. The Audit Committee is chaired by Zubyr Soomro, while the HR & Compensation Committee is led by Omar Saeed. These structures ensure ethical decision-making, risk management, and performance alignment.
Ethical Culture & Transparency
SYS promotes a values-driven culture built on trust, integrity, and innovation. Its ESG commitments, transparent reporting, and character-based leadership reflect a long-term focus on responsible growth and stakeholder engagement.
News & Announcements – Systems Limited
AI-Led Transformation
SYS is scaling its GenAI Studio globally, offering no-code, model-agnostic AI solutions. It’s investing in workforce training and expanding delivery hubs to support AI-first transformation across industries from IT operations to healthcare.
Corporate Restructuring
In 2024, SYS transferred key subsidiaries (e.g., TechVista Systems FZ LLC, SVPL Egypt) to Systems International Pte Ltd under a Scheme of Arrangement. This move consolidated control and resulted in the issuance of 66.86 million shares to SYS.
Financial Performance
Despite currency challenges like the Argentine peso depreciation, SYS maintained strong margins: 33.2% gross profit in North America and 39% in Europe. It reversed impairment losses and posted solid earnings, supported by a strong pipeline of new AI-driven business.
Awards & Recognition
SYS received over 15 major awards in 2024, including:
- Microsoft Inner Circle (4th year)
- Temenos Regional Delivery Partner of the Year
- Forbes Asia Best Under a Billion
- PSEB Top IT Exporter
- AWS Partner Finalist
These honours reflect its leadership in digital transformation, financial technology, and global delivery.
Conclusion
Systems Limited is more than a tech company; it’s a strategic force driving digital transformation across borders. With a strong global presence, deep partnerships, and a future-focused mindset, SYS continues to lead in AI innovation, enterprise solutions, and operational excellence.
Its ability to adapt, through restructuring, infrastructure investment, and talent development, shows a commitment to long-term value creation. Whether enabling smarter banking systems, powering telecom infrastructure, or building scalable AI platforms, SYS is shaping the future of technology in Pakistan and beyond.

One response
You write with so much clarity and confidence. Impressive!