

Over the past twenty years, mutual funds have become a foundational element of Pakistan’s capital market, offering investors a convenient and professionally managed way to access diversified portfolios. These funds, regulated by the Securities and Exchange Commission of Pakistan (SECP) and operated by licensed Asset Management Companies (AMCs) provide exposure to equities, fixed income instruments, and hybrid strategies, catering to a wide range of financial objectives such as retirement planning, wealth accumulation, and income generation.
As of September 2023, the industry comprises more than 370 open-end mutual funds, spanning categories like equity, fixed income, asset allocation, and voluntary pension schemes. This growth reflects a rising level of financial literacy among retail investors and a growing trust in collective investment vehicles. Platforms like the Mutual Funds Association of Pakistan (MUFAP) have played a key role in enhancing transparency by offering real-time Net Asset Value (NAV) updates, performance data, and sector-wise breakdowns making it easier than ever for individuals to make informed investment decisions and participate in the broader financial landscape.
Meezan Islamic Fund (MIF): Pakistan’s Largest Shariah-Compliant Equity Fund
Meezan Islamic Fund (MIF), launched on October 18, 2003, is an open-end equity mutual fund managed by Al Meezan Investment Management widely regarded as Pakistan’s premier Islamic asset management company. The fund is designed to offer investors a pathway to long-term capital growth and consistent dividend income through a portfolio of equities that strictly adhere to Islamic principles. Each investment is carefully vetted under the supervision of a dedicated Shariah Board, led by Dr. Muhammad Imran Ashraf Usmani, ensuring full compliance with Shariah guidelines. This rigorous screening process reflects the fund’s unwavering commitment to ethical investing. Over the years, MIF has earned a reputation as a reliable and transparent option for individuals seeking halal financial solutions that align with both their personal values and long-term financial aspirations.
MIF is benchmarked against the KMI-30 Index, which tracks the performance of Shariah-compliant stocks listed on the Pakistan Stock Exchange. With a high-risk profile and a long-term investment horizon, MIF has become a cornerstone for investors seeking halal exposure to Pakistan’s equity market.
Latest Performance Snapshot:
| Metric | Value |
| Fund Size (AUM) | Rs. 53,876 million (Aug 2025) |
| NAV (31-Aug-2025) | Rs. 146.66 |
| Latest Updated NAV | Rs. 154.44 (12-Sept-2025) |
| Category | Equity – Open-End |
| Benchmark | KMI-30 Total Return Index |
| Management Ratio | Up to 3.00% |
| Expense Ratio (YTD) | 4.00% (including SECP fee & govt. levy) |
| Risk Profile | High |
Portfolio Composition
Sector Allocation
Meezan Islamic Fund’s portfolio reflects a carefully curated mix of sectors that align with both market fundamentals and Shariah principles. Rather than chasing speculative trends, the fund emphasizes industries with tangible assets and long-term growth potential. This approach not only ensures ethical compliance but also positions the fund to benefit from Pakistan’s evolving economic landscape. Below is the latest sector-wise allocation snapshot, offering a glimpse into how MIF balances opportunity with conviction:
| Sector | Allocation (%) |
| Cement | 21.28% |
| Oil & Gas Exploration Companies | 20.81% |
| Power Generation & Distribution | 9.78% |
| Fertilizer | 7.91% |
| Commercial Banks | 7.05% |
| Others | 30.98% |
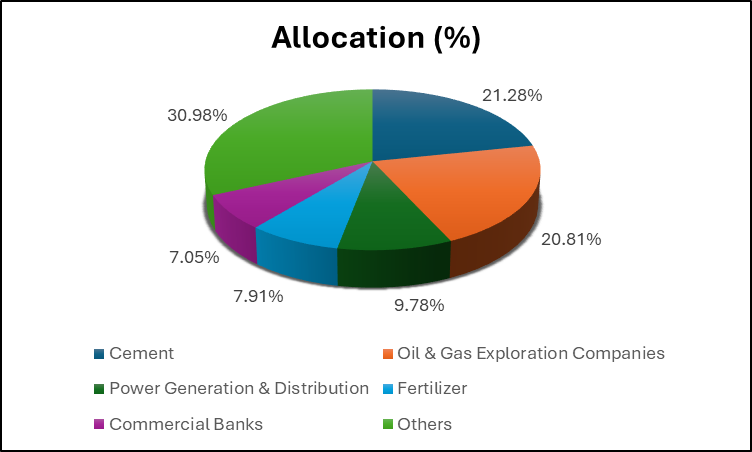
The fund’s largest allocations —Cement (21.28%) and Oil & Gas Exploration (20.81%) —signal a strong tilt toward infrastructure and energy, two sectors that remain vital to Pakistan’s development narrative. The presence of Power Generation & Distribution (9.78%) and Fertilizers (7.91%) further reinforces the fund’s exposure to essential services and agrarian support systems. Interestingly, Commercial Banks (7.05%) are included through Islamic banking channels, reflecting the growing role of Shariah-compliant financial institutions. The Others (30.98%) category encompasses diversified holdings across compliant consumer goods, technology, and industrials, adding breadth without diluting the fund’s ethical stance. Overall, this allocation strategy demonstrates MIF’s commitment to both performance and principled investing.
Top 10 Holdings
Meezan Islamic Fund’s top holdings reflect a focused strategy built around high-performing, ethically screened companies across key sectors.
| Company | % of Total Assets |
| Lucky Cement Limited | 10.91% |
| Oil & Gas Development Company Limited | 10.06% |
| The Hub Power Company Limited | 8.18% |
| Mari Energies Limited | 7.37% |
| Meezan Bank Limited | 7.01% |
| Systems Limited | 5.30% |
| Fauji Fertilizer Company Limited | 3.73% |
| Engro Holdings Limited | 3.56% |
| Pakistan Petroleum Limited | 3.38% |
| Pakistan State Oil Company Limited | 3.33% |
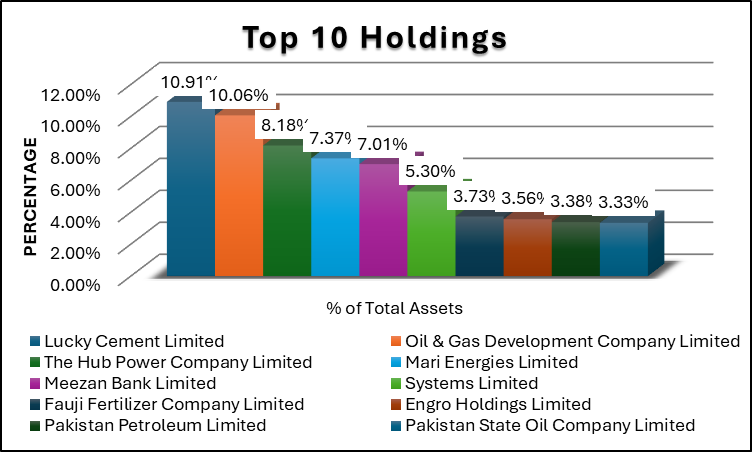
Leading the portfolio is Lucky Cement (10.91%), a bellwether for infrastructure growth, followed closely by OGDCL (10.06%) and Hub Power (8.18%), anchoring the fund’s energy exposure. Mari Energies (7.37%) and PSO (3.33%) reinforce this theme, while Meezan Bank (7.01%) adds financial depth through Islamic banking. The inclusion of Systems Limited (5.30%) signals a forward-looking stance on tech, and Fauji Fertilizer, Engro Holdings, and Pakistan Petroleum round out a portfolio that balances industrial strength with ethical discipline. Together, these holdings embody MIF’s commitment to principled growth in Pakistan’s evolving economy.
Performance Analysis
Annual Returns (FY2021–FY2025)
Over the last five years, the Meezan Islamic Fund (MIF) has moved largely in tandem with the market, participating in both rallies and downturns, though with mixed relative performance against its benchmark.
| Fiscal Year | MIF | Benchmark | Relative Performance |
| FY25 | 59.22% | 46.24% | 12.98% |
| FY24 | 73.00% | 78.70% | -5.70% |
| FY23 | -2.54% | 2.88% | -5.42% |
| FY22 | -11.27% | -10.25% | -1.02% |
| FY21 | 35.50% | 39.32% | -3.82% |
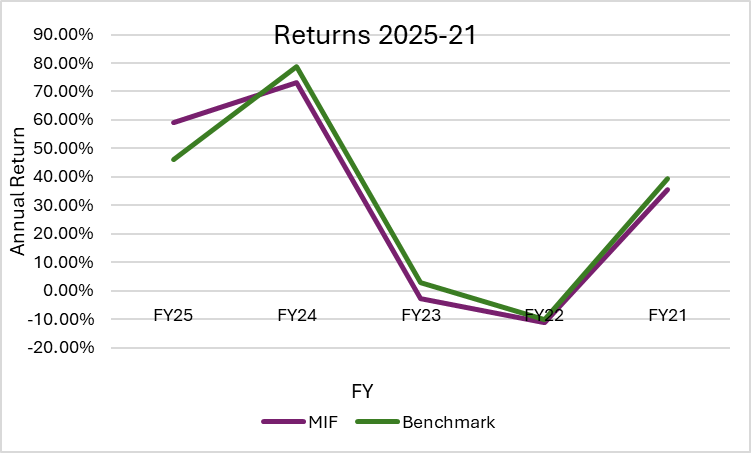
In FY2021, MIF posted a healthy +35.5% return, closely tracking the benchmark’s +39.3%, though slightly underperforming by 3.8 percentage points during the post-COVID market recovery. The following years proved difficult, as FY2022 and FY2023 brought negative returns of -11.3% and -2.5% respectively, both lagging behind the benchmark and reflecting the strain of political and macroeconomic headwinds.
Momentum shifted in FY2024, when the market surged dramatically. MIF delivered an impressive +73.0%, though it still trailed the benchmark’s +78.7%, suggesting that while the fund captured the rally, it did not fully match the index’s momentum. In contrast, FY2025 marked a strong comeback, with MIF rising +59.2%, outperforming its benchmark by nearly 13 percentage points—its best relative showing in the five-year period, underscoring improved stock selection and active management.
Overall, MIF has demonstrated resilience across market cycles, with particular strength in FY2025, highlighting its ability to generate alpha in bullish conditions, even if some past upswings were partially missed.
Dividend Payouts
Dividend distributions from the Meezan Islamic Fund (MIF) have historically been irregular, reflecting its positioning as a growth-focused equity fund rather than an income-oriented vehicle. Over the past five years, payouts have been limited, with the most recent dividend declared in FY2024 (Rs. 13.13 per unit) and earlier in FY2020 (Rs. 2.50 per unit).
| Fiscal Year | Dividend (Rs. /Unit) |
| FY25 | – |
| FY24 | 13.1345 |
| FY23 | – |
| FY22 | – |
| FY21 | – |
| FY20 | 2.5 |
MIF’s dividend history indicates that payouts are supplementary rather than central to its value proposition. Investors relying on consistent income may find these distributions insufficient, but those prioritizing capital appreciation and long-term wealth creation will recognize that dividends play only a secondary role in MIF’s strategy.
Long-Term Performance – Meezan Islamic Fund (MIF)
The long-term performance of the Meezan Islamic Fund (MIF) shows strong resilience across different horizons. While the fund has occasionally lagged the benchmark, it has generally delivered consistent value and notable outperformance over the long run.
| Period | MIF Return | Benchmark | Comment |
| 1 Month | 8.46% | 7.85% | Outperformed |
| 3 Months | 17.66% | 17.57% | In line |
| 6 Months | 27.45% | 25.13% | Outperformed |
| FYTD | 13.68% | 14.87% | Slight lag |
| 1 Year | 81.25% | 70.18% | Strong outperformance |
| 3 Years (Cumulative) | 194.09% | 201.89% | Benchmark ahead |
| 5 Years (Cumulative) | 209.90% | 223.48% | Benchmark ahead |
| PSD (Point-to-Start Date Return) | 3488.33% | 2745.85% | Very strong outperformance |
| CAGR | 17.60% | 16.38% | Outperformed |
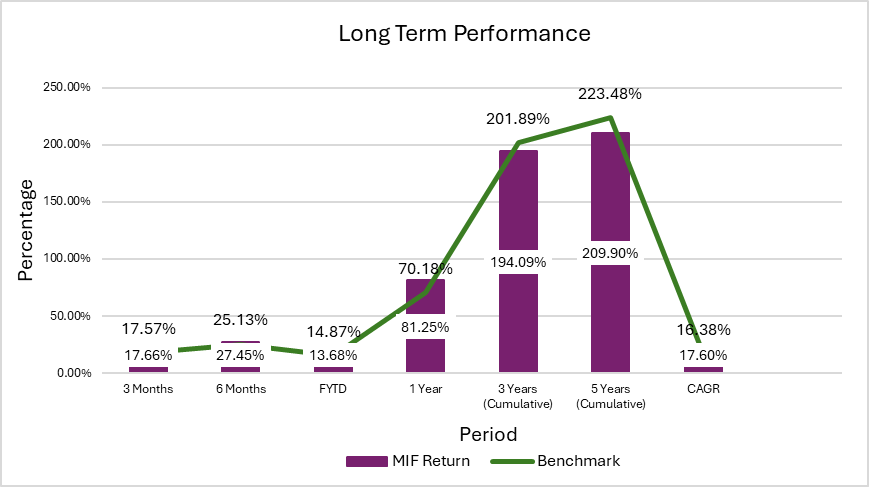
The Meezan Islamic Fund (MIF) has delivered a strong performance across most horizons, with short-term results showing consistent strength. Over the one-month and six-month periods, the fund outperformed its benchmark, while its three-month return remained nearly in line. However, on a year-to-date basis, it posted a slight lag compared to the benchmark.
The fund’s one-year performance stands out as a key highlight, with MIF gaining 81.25% versus 70.18% for the benchmark, reflecting significant resilience and market positioning. Over the medium term, the picture is more balanced, as the fund’s three- and five-year cumulative returns trailed slightly behind the benchmark.
Long-term results, however, confirm MIF’s value creation. Since launch, the fund has achieved a remarkable 3,488.33% return against the benchmark’s 2,745.85%, with a superior CAGR of 17.6% compared to 16.38%. This demonstrates MIF’s ability to generate sustained outperformance for investors, even if short phases of underperformance occur along the way.
Risk & Efficiency
The risk and efficiency indicators of the Meezan Islamic Fund (MIF) provide important insight into how the fund balances return generation with market exposure. These measures highlight the fund’s volatility, responsiveness to market movements, and ability to deliver returns relative to risk. Evaluating them helps investors understand not only the performance outcomes but also the consistency and stability behind those results.
| Metric | Value |
| Standard Deviation | 2.02 |
| Sharpe Ratio | 1.55 |
| Portfolio Turnover Ratio | 34.20% |
| Portfolio Information Ratio | -1.05 |
| Beta | 1.22 |
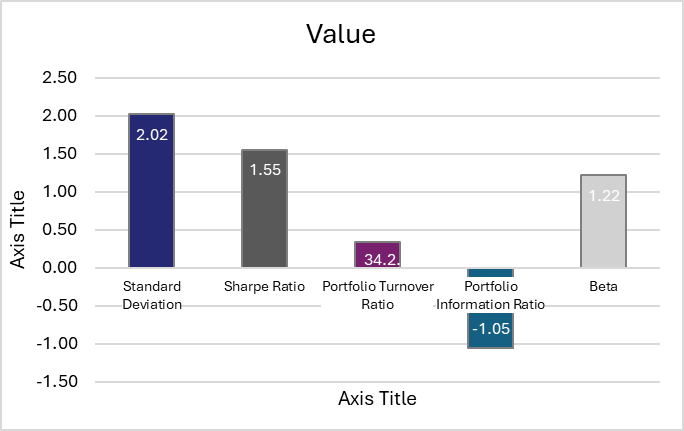
The risk profile of the Meezan Islamic Fund (MIF) shows a moderately active strategy, with a turnover ratio of 34.2% reflecting selective adjustments rather than frequent trading. A beta of 1.22 indicates higher sensitivity to market swings, yet the standard deviation of 2.02% remains well below the KSE-100 and KMI-30, suggesting controlled volatility.
On efficiency, the Sharpe ratio of 1.55 points to strong risk-adjusted returns, slightly ahead of market benchmarks. However, the negative information ratio (-1.05) highlights difficulty in consistently generating alpha in the short term, despite solid long-term performance.
Comparative Positioning
The performance history of the Meezan Islamic Fund (MIF) shows how it has behaved across market cycles. Comparing it with the benchmark highlights its ability to outperform in rallies, manage risks, and create long-term value, while also revealing periods of relative weakness.
| Metric | MIF | Benchmark | Comment |
| FY2025 Return | 59.22% | 46.24% | Strong outperformance |
| Best Year (2018–25) | 73.00% (FY24) | 78.70% (FY24) | Lagged benchmark rally |
| Worst Year (2018–25) | -24.30% (FY19) | -23.80% (FY19) | Slightly higher downside |
| Since Launch (PSD) | 3488.33% | 2745.85% | Very strong outperformance |
| CAGR | 17.60% | 16.38% | Outperformed |
The comparative positioning of the Meezan Islamic Fund (MIF) shows a strong ability to deliver superior long-term results, despite short-term fluctuations. In FY2025, MIF posted a robust 59.22% gain, comfortably ahead of the benchmark’s 46.24%. Its best year in the past cycle was FY2024, when the fund rose 73.0%, though it lagged the benchmark’s exceptional 78.7% rally. Conversely, the fund’s worst year was FY2019, with a steep -24.3% decline, slightly deeper than the benchmark’s -23.8%.
Despite these swings, MIF’s long-term profile remains compelling. Since inception, it has achieved a point-to-point return of 3488.33% and a CAGR of 17.6%, both ahead of the benchmark. This track record underscores its strength as a Shariah-compliant equity fund capable of delivering sustained value to patient investors.
Investor Suitability
The Meezan Islamic Fund (MIF) is best suited for investors who:
- Seek Shariah-compliant investments and want exposure to Pakistan’s equity market without compromising on religious principles.
- Have a long-term horizon, as the fund’s performance is cyclical, with potential short-term volatility but strong compounding over time.
- Are comfortable with high risk, since equity-heavy portfolios can experience significant fluctuations during downturns, though they also capture strong upside in bull markets.
- Prefer professional management, benefiting from Al Meezan’s research-driven stock selection and sector allocation strategies.
Conversely, MIF may not be ideal for investors who:
- Require capital protection or guaranteed returns, as the fund does not offer downside guarantees.
- Have a short-term investment horizon, since short phases of underperformance relative to the benchmark can occur.
- Prefer low-risk or fixed-income products, as MIF’s equity exposure makes it unsuitable for conservative investors seeking stability.
Conclusion
The Meezan Islamic Fund (MIF) stands out as Pakistan’s largest and most prominent Shariah-compliant equity fund, with a proven ability to create long-term value despite periods of underperformance. Its sector allocations, diversified holdings, and strong track record since inception reflect both ethical discipline and growth potential. For investors aligned with its risk-return profile and seeking halal exposure to equities, MIF remains a compelling choice in Pakistan’s mutual fund landscape.
No responses yet