

Why Mutual Funds Matter
Investing in financial markets is never just about numbers; it is about trust, discipline, and the ability to stay invested through cycles of highs and lows. For many investors, mutual funds are the bridge between complex capital markets and personal financial goals. They allow ordinary savers to access professional management, diversification, and a structured way to participate in wealth creation.
In Pakistan, where the equity market has often been volatile yet rewarding, mutual funds play an especially important role. Managed by NBP Fund Management Limited, the NBP Stock Fund (NSF) ranks among the most well-known equity mutual funds. This fund has been around for nearly two decades and has built a reputation as a vehicle for long-term growth. Its history reflects Pakistan’s own economic journey—marked by struggle, resilient comebacks, and enduring strength.
Fund Overview
The NBP Stock Fund (NSF) is a flagship open-end equity mutual fund managed by NBP Fund Management Limited, a leading asset manager and a subsidiary of the National Bank of Pakistan. Launched in January 2007, NSF aims to deliver long-term capital growth by investing primarily in listed equities on the Pakistan Stock Exchange (PSX).
As an open-end scheme, investors can enter or exit the fund at the prevailing Net Asset Value (NAV) on any working day, making it both flexible and liquid. The fund follows an active management strategy, with the manager dynamically adjusting allocations across sectors and stocks based on market outlook, macroeconomic indicators, and company fundamentals. This allows investors to benefit from professional stock selection without directly managing equity portfolios themselves.
As of July 31, 2025, the fund reported an asset base of Rs. 44,174 million, placing it among the largest equity funds in Pakistan. As of the Date, the Net Asset Value (NAV) per unit was Rs. 35.8017, while the latest updated NAV is Rs. 39.5813, reflecting recent market gains. With a management fee of up to 3% per annum and a total expense ratio of 3.79%, NSF maintains a high-risk profile, consistent with its equity-focused mandate and long-term growth potential.
Key Facts (as of July 31, 2025):
| Fund Size (AUM): Rs. 44,174 million |
| NAV (31-Jul-2025): Rs. 35.8017 |
| Latest Updated NAV(09-09-2025): Rs. 39.5813 |
| Category: Equity – Open-End |
| Benchmark: KSE-30 Total Return Index |
| Management Fee: Up to 3% p.a. |
| Expense Ratio: 3.79% (including govt. levy) |
| Risk Profile: High |
Portfolio Analysis
Sector Allocation
The NBP Stock Fund (NSF) maintains diversified exposure across Pakistan’s core economic sectors, reflecting both the composition of the Pakistan Stock Exchange (PSX) and the fund’s active strategy. As of July 31, 2025, the sectoral breakdown was as follows:
| Sector | Allocation % |
| Commercial Banks | 18.1% |
| Oil & Gas Exploration | 16.4% |
| Fertilizer | 13.4% |
| Cement | 9.4% |
| Textile Composite | 5.8% |
| Others | 36.9% |
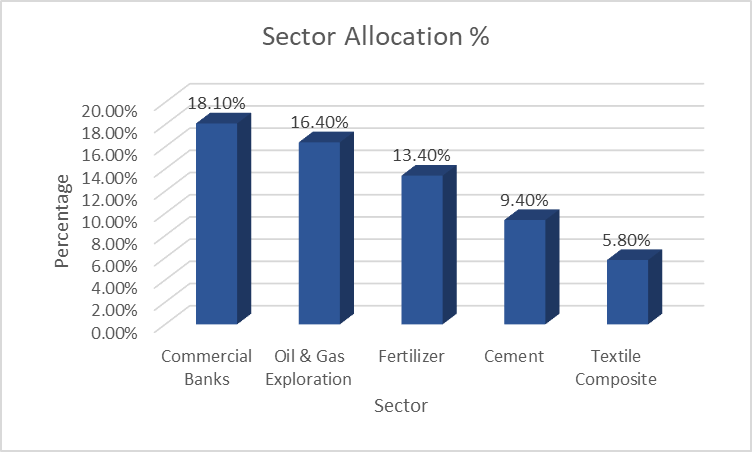
NSF’s largest exposure is to commercial banks (18.1%), in line with the dominance of financials in the PSX. This sector offers both earnings growth in high-interest-rate environments and liquidity for the fund’s portfolio. The second largest allocation is to oil and gas exploration (16.4%), a sector sensitive to global energy prices but also historically rewarding for long-term investors due to dividend flows from companies such as OGDCL and PPL.
Fertilizers (13.4%) provide defensive, stable returns, underpinned by strong domestic demand and cash dividends. Meanwhile, cement (9.4%) and textiles (5.8%) serve as cyclical growth plays, with their fortunes closely tied to domestic infrastructure and housing projects, as well as export demand. The 36.9% allocation to “others” ensures diversification across power, technology, and consumer sectors. Collectively, this structure balances income stability with growth potential.
Top 10 Holdings
| Company | Allocation % |
| Fauji Fertilizer Co. Ltd | 9.7% |
| Oil & Gas Development Co. Ltd | 7.4% |
| Pakistan Petroleum Ltd | 7.2% |
| Kohat Cement Ltd | 6.2% |
| Askari Bank | 4.9% |
| Hub Power Co. | 3.2% |
| Kohinoor Textile Mills | 2.9% |
| Bank Alfalah | 2.6% |
| Pakistan State Oil | 2.5% |
| Habib Bank Ltd | 2.3% |
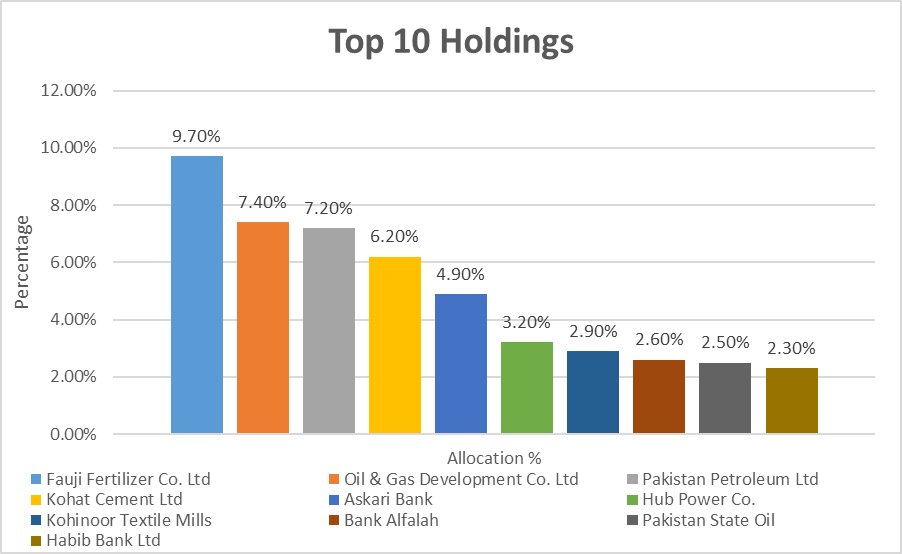
The top three holdings, Fauji Fertilizer, OGDCL, and PPL, account for nearly 24% of the portfolio, reflecting NSF’s emphasis on stable dividend-paying sectors such as fertilizers and energy. Fauji Fertilizer provides consistent cash flows, while OGDCL and PPL capture exposure to Pakistan’s energy resources, albeit with commodity-linked volatility.
Kohat Cement (6.2%) represents a strong cyclical bet tied to domestic construction and infrastructure activity. The banking sector is represented by Askari Bank (4.9%) and Bank Alfalah (2.6%), both benefiting from robust loan growth and improving margins. Hub Power Co. (3.2%) ensures recurring earnings from the power sector, while Pakistan State Oil (2.5%) provides exposure to downstream energy. Finally, Habib Bank (2.3%) anchors the portfolio with a large-cap financial institution.
Overall, NSF shows a preference for sector leaders with liquidity and dividend strength, while maintaining selective exposure to mid-cap growth stories like Kohinoor Textile.
Performance Analysis
Annual Returns (FY2021–FY2025)
Over the five-year period, the NBP Stock Fund (NSF) has broadly followed the market cycle, rising during bullish phases and declining during downturns, yet with varying degrees of success relative to its benchmark.
| Fiscal Year | NSF Return | Benchmark | Relative Performance |
| FY2025 | 67.4% | 64.2% | +3.2% |
| FY2024 | 85.1% | 95.0% | -9.9% |
| FY2023 | -2.2% | 4.4% | -6.6% |
| FY2022 | -14.0% | -10.4% | -3.6% |
| FY2021 | 35.9% | 36.5% | -0.6% |
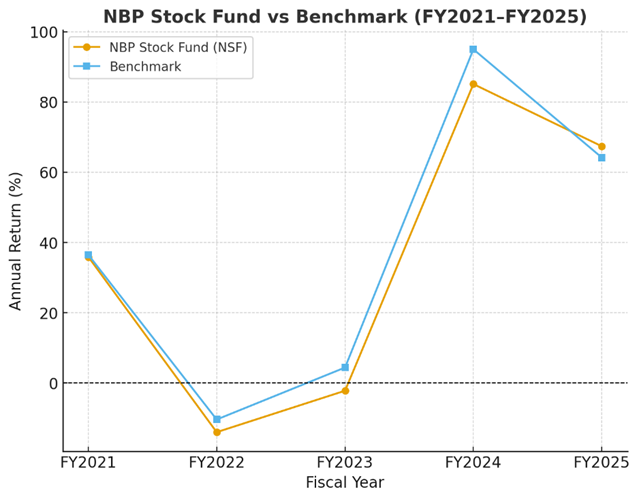
In FY2021, NSF delivered a strong +35.9% return, almost mirroring the KSE-30’s performance, showing effective tracking during the post-pandemic recovery. However, the subsequent FY2022 and FY2023 periods were challenging, as political uncertainty, currency depreciation, and high inflation dragged equities lower. NSF declined by -14.0% in FY2022 and -2.2% in FY2023, underperforming the benchmark in both years, highlighting its sensitivity to downside risk.
The turning point came in FY2024, when the PSX staged a record-breaking rally. NSF gained an impressive +85.1%, though still trailed the benchmark by nearly 10 percentage points, suggesting it lagged in capturing the full momentum of the market. In FY2025, the fund rebounded with +67.4%, this time outperforming the benchmark by 3.2%, reflecting better active management decisions. Overall, the pattern shows NSF’s strength in upcycles, though it occasionally sacrifices peak returns in exchange for risk control.
Rolling & Long-Term Performance
The rolling and long-term performance of the NBP Stock Fund (NSF) reflects its ability to track the market closely while delivering notable value over extended horizons. The fund’s short-term performance has been uneven, showing strength in some periods while underperforming in others.
| Period | NSF Return | Benchmark | Comment |
| Jul-2025 (MTD) | 10.9% | 11.7% | Slight lag |
| CYTD 2025 | 16.2% | 22.1% | Benchmark ahead |
| Rolling 12M | 87.9% | 84.8% | NSF outperformed |
| 3 Years (CAGR) | 51.2% | 57.0% | Benchmark ahead |
| 5 Years (CAGR) | 27.9% | 31.8% | Benchmark ahead |
| 10 Years | 15.3% | 15.1% | In line |
| Since Launch | 16.6% | 11.4% | Strong outperformance |
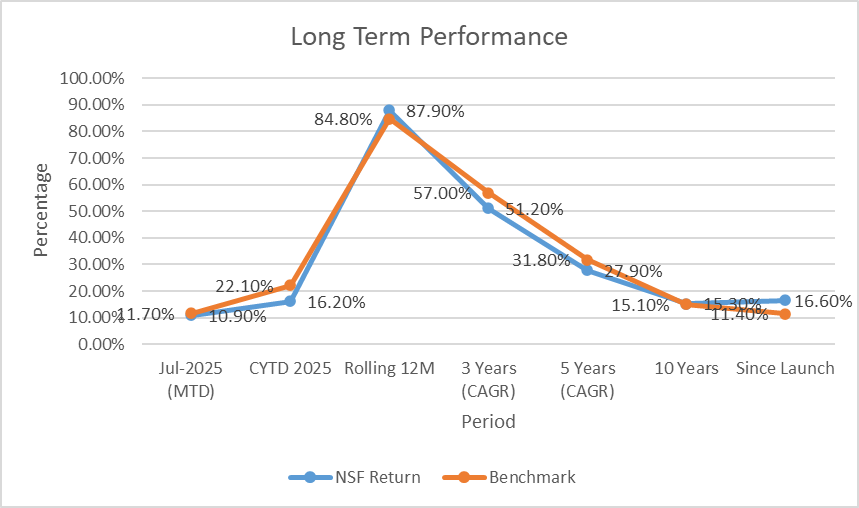
For July 2025, NSF posted a return of 10.9%, slightly behind the benchmark. The fund’s more cautious posture is further evidenced by its CYTD 2025 return of 16.2%, which underperformed the KSE-30’s 22.1% rally.
Over the last 12 months, however, NSF outperformed with 87.9%, beating the benchmark’s 84.8%, showing its effectiveness in capitalizing on the PSX recovery. At the 3-year and 5-year horizons, the fund slightly underperformed, with returns of 51.2% and 27.9% compared to the benchmark’s 57.0% and 31.8%. This indicates that while NSF remains competitive, it has not fully matched the market’s momentum in recent cycles.
The real strength lies in the long-term record: a 10-year return of 15.3% in line with the benchmark, and since inception (2007) NSF has delivered 16.6% CAGR, significantly higher than the benchmark’s 11.4%. This establishes NSF as a long-term outperformer despite occasional short-term lags.
Risk & Efficiency
| Metric | Value |
| Portfolio Turnover Ratio | 48.3% |
| Monthly Information Ratio | -0.1 |
| Beta | 0.71 |
| Standard Deviation | 0.9% |
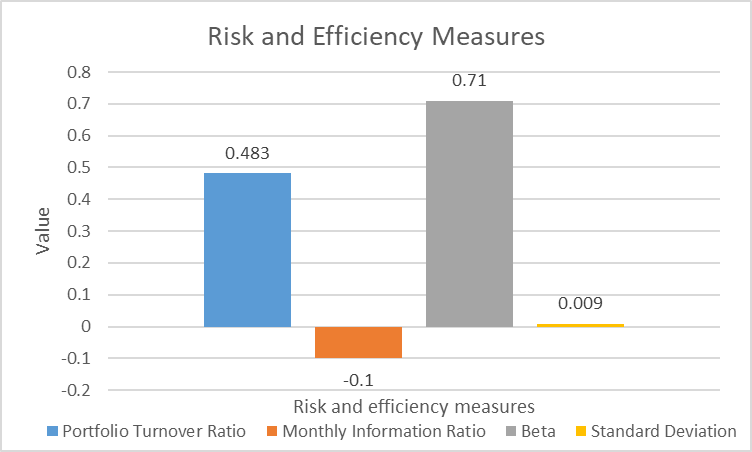
The risk and efficiency profile of the NBP Stock Fund (NSF) provides valuable insight into its management style and performance consistency. A portfolio turnover ratio of 48.3% suggests the fund is actively managed, with nearly half of its holdings being replaced or adjusted within a year. While this reflects the manager’s responsiveness to market dynamics, it may also result in higher transaction costs, which can weigh on net performance if not offset by superior stock selection.
The fund’s beta of 0.71 indicates that NSF is less volatile than the overall market. In practical terms, for every 1% movement in the benchmark, NSF historically moves around 0.71%. This relatively defensive positioning is unusual for a high-equity fund, as most equity funds tend to carry betas closer to or above 1. Combined with the standard deviation of 0.9%, the data suggest NSF has been able to deliver returns with lower near-term volatility, offering some stability in turbulent markets.
However, the monthly information ratio of -0.1 signals recent difficulty in consistently generating alpha versus the benchmark. While long-term returns remain strong, this metric highlights the challenges of active management in outperforming a broad index in the short run.
Comparative Positioning
| Metric | NSF | Benchmark | Comment |
| FY2025 Return | 67.4% | 64.2% | Outperformed slightly |
| Best Year (2021–25) | 85.1% | 95.0% | Lagged benchmark rally |
| Worst Year (2021–25) | -14.0% | -10.4% | Higher downside |
| Since Launch (2007) | 16.6% | 11.4% | Long-term outperformance |
When compared with its benchmark, the NBP Stock Fund (NSF) shows a mixed short-term profile but strong long-term strength. In FY2025, NSF slightly outperformed with a 67.4% return vs. 64.2%. However, during its best year (FY2024), the fund lagged the benchmark, and in downturns like FY2022, losses were deeper. This reflects a tendency to underperform in both corrections and euphoric rallies. Despite these short-term variances, NSF’s since inception CAGR of 16.6% vs. 11.4% demonstrates sustained long-term outperformance, validating its role as a reliable equity vehicle for patient investors.
Suitability
Suitable For:
- Long-term investors with equity appetite.
- Investors seeking diversified PSX exposure via professional management.
- Growth-oriented individuals comfortable with volatility.
Not Suitable For:
- Short-term or risk-averse investors.
- Those requiring capital protection or guaranteed returns.
Conclusion: The Enduring Story of NSF
The NSF captures the essence of the PSX: volatile in the near term, yet fundamentally rewarding for long-term investors. Its journey across crashes and rallies proves one thing: time in the market beats timing the market.
With a NAV of Rs. 39.5813, Rs. 44 billion under management, and nearly two decades of outperformance since inception, NSF stands as one of Pakistan’s flagship equity funds.
For investors with patience and belief in Pakistan’s economy, NSF is more than just an investment it is a story of resilience, discipline, and the power of compounding.
No responses yet